 Due to weakening financial markets and decreasing macroeconomic stability, the US has been ousted from the top slot in the World Economic Forum’s latest Global Competitiveness Report by Switzerland.
Effective benchmarking requires key performance indicators (KPIs) that help explain whether educational expenditures are a key driver or operating metric we should look at to help achieve higher rates of youth employment. We address this in more detail.
Not a subscriber yet? Want the scoop first? Just leave your email address in the field below.
 2009-09-08 WEF 2010 Global Competitiveness Report 2009-2010 (3.9 MiB, 6,594 hits)
- Rankings – 4.11 Education expenditure: Public education expenditure as a percentage of GNI, adjusted savings.
Rankings – 5.01 Secondary enrollment: Gross secondary education enrollment rate.
Rankings – 5.02 Tertiary enrollment: Gross tertiary education enrollment rate.
Rankings – 5.03 Quality of the educational system: How well does the educational system in your country meet the needs of a competitive economy? (1 = not well at all; 7 = very well)
Rankings – 5.04 Quality of math and science education: How would you assess the quality of math and science education in your country’s schools? (1 = poor; 7 = excellent, among the best in the world)
Rankings – 5.06 Internet access in schools: How would you rate the level of access to the Internet in schools in your country? (1 = very limited; 7 = extensive)
Hard data: Are they accurate?
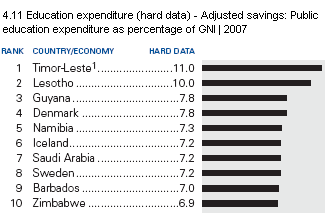 Switzerland is doing quite badly when it comes to primary education, as well as secondary education rates (e.g., Rankings 4.11). One explanation is that instead of using absolute numbers, the report uses the percentage of Gross National Income (GNI) spent on primary schooling. This could explain why countries that spend more on primary education as a percentage of GNI do better, like Lesotho or Namibia.
However, whether as a percentage of GNI or in absolute dollars per pupil, mere spending cannot assess the effectiveness of a school system. In fact, countries that spend less in absolute dollars or as part of GNI often do better than others by nevertheless achieving higher literacy rates.
Opinion data: Reliable and valid?
The opinion data is based on a survey of 13,000 executives in the ranked nations, but given Rankings 5.06, how much does an executive really know about the reality of a teacher trying to teach a classroom of fifth graders about math or finding information on the Internet using computers?
 Put differently, what does access mean: PCs connected to the Internet for each classroom or access for each child to a computer with nothing more than an operating system and a word processor?
And if we trust that executives can provide an evaluation regarding math and science education, why don’t we ask them about reading and writing as well? Graduates who are unable to write a job application without typos or grammatical errors have a tough time getting a job, don’t they?
Secondary and tertiary education: What about youth employment?
During this financial crisis, education should actually help improve one’s skill-set, thereby making teenagers (15 – 19-year-olds) and young adults (20 – 24-year-olds) more employable.
Unfortunately, the youth unemployment rate in the US was 18.5 percent in July 2009. According to the government this is the highest July rate since recording began in 1948 (download pdf report and tables).
Canada’s employment figures for June 2009 show a loss of 33,000 jobs among those 15 – 24 years old, rocketing the unemployment rate among young people to 15.9 percent, the highest in 11 years (download pdf and report summary).
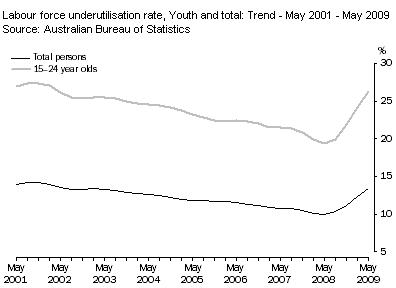 A recent report for Australia indicates a similar trend whereby the labor force underutilisation rate (LFUR = sum of unemployment and underemployment) for 15 – 24-year-olds rose from 24.2 percent in February 2009 to 26.2 percent in May 2009 (see chart at right, see five-page report).
For Switzerland, the number of unemployed youth (15 – 24-year-olds, including school leavers and students) increased from 4.6 percent in July to 5.3 percent in August 2009. Their numbers reached 29,298 which represents a three-quarter increase over August 2008 (download pdf and more details).
Bottom line
The above indicates that educational expenditures may not be comparable across countries and, as importantly, asking executives to judge an educational system may result in data that could hardly be called reliable and valid.
While Australia, Canada and the US rank highly for their participation rates in tertiary education, Switzerland gets marked down for having a strong dual system (meaning apprentices spend as little as 30 percent of their time in formal education, while the rest is spent acquiring practical skills in the workplace).
Besides, completing an apprenticeship leaves the door open for post-secondary education. Worse, not having enough qualified tradespeople on construction sites does not help improve the country’s competitiveness with regard to its infrastructure. Youth employment means all this human capital is wasted, which definitely does not improve a country’s competitiveness.
Surely, youth unemployment is an important KPI for benchmarking education policy, whereas expenditure levels tell us little about how effectively a country uses its newly trained human capital. The World Competitiveness Report 2009-2010 uses educational benchmarks whose usefulness are questionable, if not outright invalid.
More resources on KPI and benchmarking education:
- – Gary Martin: A portrait of the youth labor market in 13 countries, 1980–2007 – Monthly Labor Review July 2009, pp. 3 – 21.
– The Bologna Club: What U.S. Higher Education Can Learn from a Decade of European Reconstruction, May 2008.
– Tuning educational structures in Europe.
– OECD data: Economic returns for an individual obtaining upper secondary or post-secondary non-tertiary education, obtaining tertiary education, part of initial education (2005 data Excel spreadsheet – September 8, 2009).
– more about the World Economic Forum Davos
Looking for telework as a techie? Join our virtual team NOW!
Now, it’s your turn. What are some of your KPI and benchmarking stories regarding education and competitiveness in your neighbourhood?
Pingback: WhitePapers
Pingback: World Economic Forum
Pingback: Naijand Inc
Pingback: Toshiaki Takeuchi
Pingback: Tweets that mention WEF Global Competitiveness Report fails -- Topsy.com
Pingback: World Economic Forum
Pingback: World Economic Forum
Pingback: Very useful links: NFL bans Twitter, now with adverts