Social media monitoring DOs and DON’Ts: social media marketing, social media metrics, social media monitoring tools, benchmark test, Twitter monitoring, luxury branding and other happenings we came across while surfing the internet, blogging and posting on Facebook, Identi.ca, Naijapulse, Google Buzz, or Twitter.
 This week, our focus includes Pew’s latest report on Americans’ increasing online news consumption, Google’s latest video giving marketing giant WPP a run for its money, Bing overtaking Yahoo! in search and social media metrics, and other heavyweight brands’ trials and tribulations.
In case you missed previous weeks’ memorable moments on social media monitoring, just point your browser to:
Enter your email address to receive live blog updates in your mailbox… You’ll be glad you did.
Top off your subscription by visiting the ComMetrics University and signing up for our latest webinar:
- Tuesday, September 28 – 8:30 Uhr in German, 16:00 hours CEST (7:00 am PST) in English.
So here come the highs, lows and oddities I discovered through my various social media channels.
- Tuesday
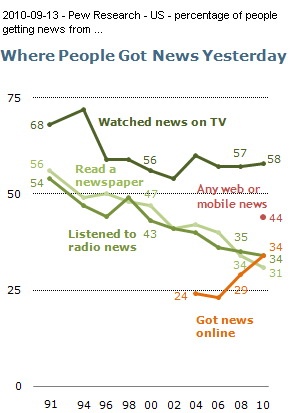
I love Pew Research, not just because of the topics they address but most importantly, because the team goes to the trouble of publishing detailed reports, including methodology and additional materials that provide deep insight into their data.
In April 2006 and May 2008, Pew asked respondents, “Would you say you spent MORE time reading the paper version or MORE time reading the online version yesterday?”
This year the question was slightly modified: “Would you say you spent MORE time reading the paper version or MORE time reading the newspaper online yesterday?” (p. 12).
Lots more material of interest: 2010-09-12 – Pew Research Report – Americans Spending More Time Following the News
Respondents reported that they spent an average of 10 minutes reading a printed newspaper, while reading online news took up 13 minutes. Given these findings, it seems print media has little to celebrate.
Resource – From fee to free: Will e-readers revive newspapers?
- Wednesday
Today I came across August’s search numbers, as reported by Nielsen.
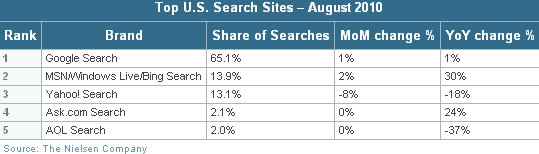
Comscore and Hitwise also rank Yahoo! in second place. While we can debate these numbers, trend analysis indicates that Bing is gaining market share.
- Friday
Interestingly, none of the social media metrics used enjoy an adoption rate above 50 percent (see graphic), indicating that this medium still has a long way to go to reach maturity.
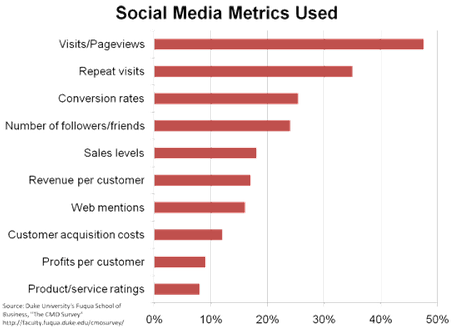
The measures that are easiest to collect (e.g.,pageviews and unique visitors) seem to win the day. Measuring visits may not lead to direct sales, but it helps expand the pool of potential clients.
However, you may wonder whether non-consumer companies such as small service or manufacturing organizations should be using these particular measures. Actionable metrics require that any numbers result in action: what action will be taken if a certain number of pageviews is not achieved?
Numbers are not necessarily what they seem.
It is a challenge not to rely too much on simplistic statistics when assessing the impact of social media. We must find ways to better understand ranking and statistical tools and augment these with other means of assessment.
- Download the report: The CMO survey results – Highlights and insights August 2010
- Saturday
Twitter monitoring tells is that the service is moving toward Facebook-ification, in part due to program changes released this past Monday.
Now the company has decided to release a video (also known as a video ad) to get people’s attention. It was apparently low-budget (around US$3,000 dollars in direct costs only, I would think) and should entice us to take advantage of all these tools.
I am not sure… While one million people watched it within a few hours of release, I found it rather boring.

To illustrate, watch Google’s video (see below) and tell me if you think there is a difference.
- Sunday
Client: Google / Arcade Fire => Agency: Google Creative Labs
Sir Martin Sorrell, chief executive of WPP, the world’s largest advertising, marketing and communications group, suddenly finds himself threatened in his core business, by Google, no less.
Together with Canadian band Arcade Fire, Google Creative Labs has created a music video that is partly a game, and shows me my backyard. While I found it disturbing, it also kept me interested and watching.
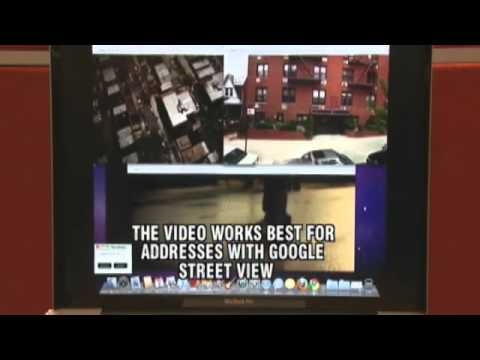
The video is designed to showcase Google Chrome, which is tuned for HTML5. You enter your postal code, allowing the ad to show off what features can be used to make it a seamless experience, before making your house part of the video (it is eventually overrun by animated trees).
Check out the film I got for our offices, and be surprised.
What does this mean for advertising and social media marketing? Well, this is the first time Google Creative Labs has created a video that is definitely one of the top 10 social media campaigns for 2010. Who knows, maybe Google will become a serious competitor in the advertising business.
Have an opinion on this? Did we forget a DO or DON’T for social media that you know about? Please share in the comments; I love to hear what works for you!
Article source: ComMetrics weekly review: Social media marketing and monitoring
Pingback: World Economic Forum
Pingback: WhitePapers
Pingback: Jay Peete
Pingback: Richard E. Byrd
Pingback: World Economic Forum
Pingback: Frank Tenorio
Pingback: Social Media
Pingback: Anthony B Palmer
Pingback: Anthony B Palmer
Pingback: Gordon Green
Pingback: David Lee Martin
Pingback: Interest Media
Pingback: Brandon Klemm
Pingback: CyTRAP
Pingback: Urs E. Gattiker
Pingback: Gerry O'Neill
Pingback: KaylasHall
Pingback: Alex Hall
Pingback: Joycelyn Wiseman