If you do not have 10 minutes, do not read on – otherwise learn why sometimes business school rankings are funny and other times outright misleading.
1. Business analytics: Best practices for success (October 2, 2012)
2. Business analytics: Arbitrary rankings, anyone? (November 20, 2012 – you are here)
3. Business analytics: Raise your hand if you hate research (January 2013)
 The Smart Data Collective recently pubilshed a nice series on data issues, including:
The series indicates that we may have more data than we can properly handle – technology is not the issue. However, lack of skills or human capital can be quite detrimental. This post outlines why when we create rankings we should always ask ourselves: Can we trust them?
Since college rankings are very popular, I focus on business analytics and business school rankings (see also Business school rankings from the Financial Times: Do we need them?).
Bloomberg Businessweek – attractiveness versus public opinion
US News & World Report‘s popular college ranking appears annually, allowing the magazine to sell more copies of that issue than any other throughout the year. To cash in on this revenue bonanza, Bloomberg Businessweek decided to do something similar.
It all started with a 2009 article called, “Campus Life: A Report Card“. Businessweek followed up with the 2010 report, and by 2011 they felt confident enough to declare this an annual ranking exercise. For instance, 2010 females at Boston University were graded a B-minus, and males were marked a B. However, in 2011, Boston University’s women were ranked a B-plus and males stayed at a B.
In the 2011 report, Businessweek outlines how it arrived at those rankings.
“Every year Bloomberg Businessweek partners with College Prowler, which surveys college students throughout the U.S. and uses those surveys to grade each school on everything from academics to nightlife to off-campus housing.”
College Prowler does provide information on academics, scholarships, and other collegiate issues, but it also lets students rank colleges by factors like, “hot girls”.
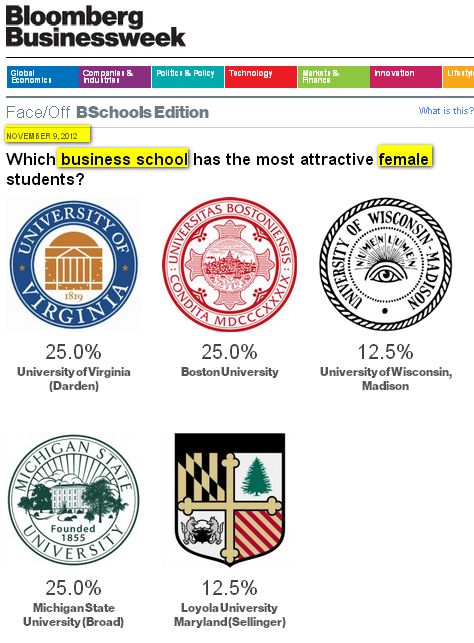
Readers’ overwhelmingly negative response to this poll forced Businessweek to remove it. On November 12, 2012, Bloomberg Businessweek issued an apology on its Facebook page, saying the polls were in, “poor taste.”
What about methodology?
Interval and ratio data are considered parametric, and used in conjunction with statistical tools in which distributions are predictable and often normal. Parametric statistics assume a normal underlying bell-shaped distribution, which is often forced through means of samples (for more information see Gattiker, 2011 – download for free below).
For anyone who dislikes statistics, I explain this challenge here:
FREE ebook: Raise your hand if you hate research. ComMetrics eBook series #2011-01 (783 KB – pdf)
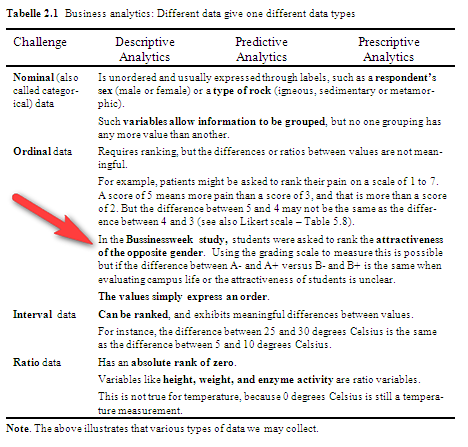
How does this relate to the Bloomberg Businessweek study?
What is the difference between students ranked with an A-minus versus a school where the guys are ranked a B-plus?
Apparently, the latter is worse than the former, but unless we understand what criteria were used to arrive at this score by each survey participant, the College Prowler findings are navel-gazing metrics that are not at all helpful. Certainly such silly and potentially distasteful rankings should not affect any kid’s choice of which college they might attend, should they?
Tip 1 – Business Analytics 101: Just because you can, does not mean you should collect data and if you do, first ensure you do it right.
How stable are these rankings – beware of the Yo-Yo effect
If we do a four-year comparison between the 10 best athletes doing the 100 meters, Usain Bolt will probably rank high for each one of the last four years.
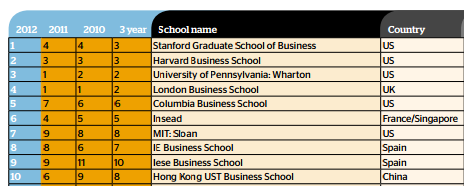
Ranking a racer requires using ratio data (see Table 2.1), i.e. the athlete’s fastest clocked time. However, a business school ranking is a mixture of nominal, ordinal and ratio data. Moreover, if schools can move up and down the rankings quite a bit within a couple of years, the stability and validity of such rankings must be questioned. For instance, Hong Kong University of Science and Technology‘s ranking changed in 2010 (ninth), 2011 (sixth), and 2012 (tenth). Even Columbia University went from sixth (2010), to seventh (2011), to fifth (2012).
Tip 2 – Business Analytics 101: Good statistical analysis on the wrong data (validity and reliability) leads to the wrong results. The issue is usually not how to work with big data but having good data, not data that results in incorrect findings (Are blog rankings just distracting?).
Bottom line
As Annie Pettit suggests:
I would add,
“In business analytics, perfect data sets do not exist. Nonetheless, we must be aware of and communicate potential methodological issues concerning our data set that could negatively affect the reliability, validity and usefulness of our findings.”
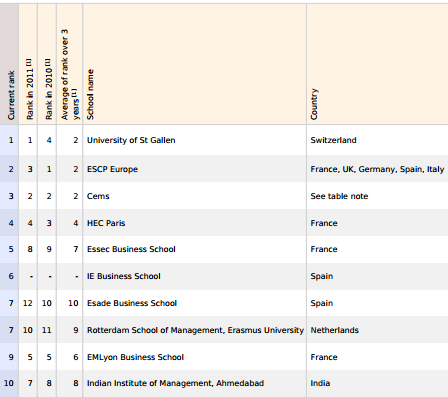
It also helps if the rankings do not rely on data from schools under pressure to report information in the best possible light (see also Table 1.1). Finally, if business school rankings are not very useful in determining which schools provide the best value for money and/or best-quality education, why do we all continue to put so much emphasis on them? I know it’s not because we’re stupid…
By the way, on November 12, 2012 the Financial Times published something called Innovative Law Schools 2012 with a permalink that includes the word ‘ranking’: http://rankings.ft.com/lawschools/rankings. The fact is that the list contains no rankings (“Footnote: This table was compiled from a list of schools that completed a Financial Times survey in Oct 2012.”), nor does it address the word innovation. One way to raise interest, but is it ethical?
As always, I look forward to reading your thoughts and comments below!
More resources about Likert scales, parametric statistics, methodology, etc.
– Social media metrics: 5 critical steps to success
– Why no one in his right mind should believe the school grades OR the teacher growth scores
– Turning the tables: Ranking the MBA rankings
– Big data – methodology, research, statistics and parametrics… (just click the URL to query and get some very interesting results – more ComMetrics content).

The author: This post was written by social media marketing and strategy expert Urs E. Gattiker, who also writes about issues that connect social media with compliance, and thrives on the challenge of measuring how it all affects your bottom line.
His latest book, Social Media Audit: Measure for Impact, will appear in 2012 from Springer Science Publishers.
Connect with ComMetrics on Google+ or the author using: Email | Twitter | Google+ | Xing
Pingback: World Economic Forum
Pingback: Urs E. Gattiker
Pingback: Foundation survey | INFO-BLOGGER.NET
Pingback: DrKPI Urs E Gattiker
Pingback: Frank Lenarduzzi
Pingback: Justice Mitchell
Pingback: Stats News Network
Pingback: Alex Hall
Pingback: WhitePapers
Pingback: Alex Hall
Pingback: Alex Hall
Pingback: Alex Hall
Pingback: Urs E. Gattiker
Pingback: MyComMetrics
Pingback: KPI,ROI,analytics,analysis, influence,resonance,reader comment,metrics