Why your network referrals might matter less than your plug-ins – a five-point checklist.
 A while back we had a series of posts addressing, Is Facebook engagement obsolete?, and one by Simona Stavrova about Facebook advertising and engagement success, followed by The new Myspace: Too little innovation, too late? from Celina Conner.
Now Dane Cobaine details five steps that help make Google Analytics work for us.
Why monitoring things makes sense
John Wanamaker once said: “Half the money I spend on advertising is wasted; the trouble is I don’t know which half.” It is a quote that rings true with marketers across the world, and the industry thrives on metrics and measurements.
 Why, then, are marketers so hesitant to measure the success of social media programs?
While it is true that social can be difficult to effectively measure, it is not impossible and some basic measurements can be taken with little or no expertise.
It does not have to be expensive, either – while tools like Radian6 and Sysomos can cost thousands every year, free tools like Google Analytics provide an excellent alternative. Whether expensive or free, such tools allow you to follow your visitors as they progress through your user journey and ultimately convert in to new leads and paying customers.
Step 1: Set up shop
The first thing to do is to set up your analytics – sign up for a free Google account and ask your web developers to add the tracking code to your site. You cannot learn from your data if you have no data to begin with, and so the earlier you can implement the tracking code, the better. You will begin to gather information from your visitors immediately.
Step 2: Take inventory
As we explained in our business analytics article, from here the best way to get things going is to review the existing state of the data. You will want to get a good idea of the way that people are using your website, what devices and browsers they use and what kind of conversion rate you are experiencing.
It is important to benchmark this on a regular basis so that you can measure the response to your social media campaign. In fact, we have previously written about the importance of baselines when assessing progress against key performance indicators (KPIs) and business objectives.
Step 3: Start tracking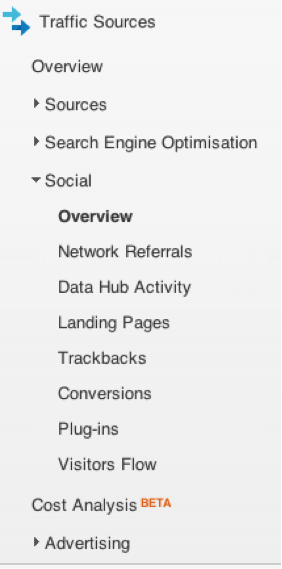
Now it gets interesting – the actual social media measurement. Google Analytics is an extremely versatile tool, and it allows you to filter, export and arrange your data to your own specifications – however, you can discover useful nuggets of information from a basic install.
Log in to your Google Analytics dashboard, open the Traffic Sources menu and navigate to the Sources submenu.
Here, you can view the list of sites that have driven traffic to you. Under All Traffic, you will be able to view the full list of referring sites, of which Google itself is likely to be at the top if you have invested time and money in a search engine optimisation (SEO) strategy.
A rough breakdown of the social sites that are driving traffic to your website also appears, coupled with further statistics such as the average visit duration and the percentage of these visitors who have never viewed the site before. You can look at charts of these visitors, modify the time range that is being reported on and even compare your traffic levels to the same time last month or last year.
Step 4: Dig deeper
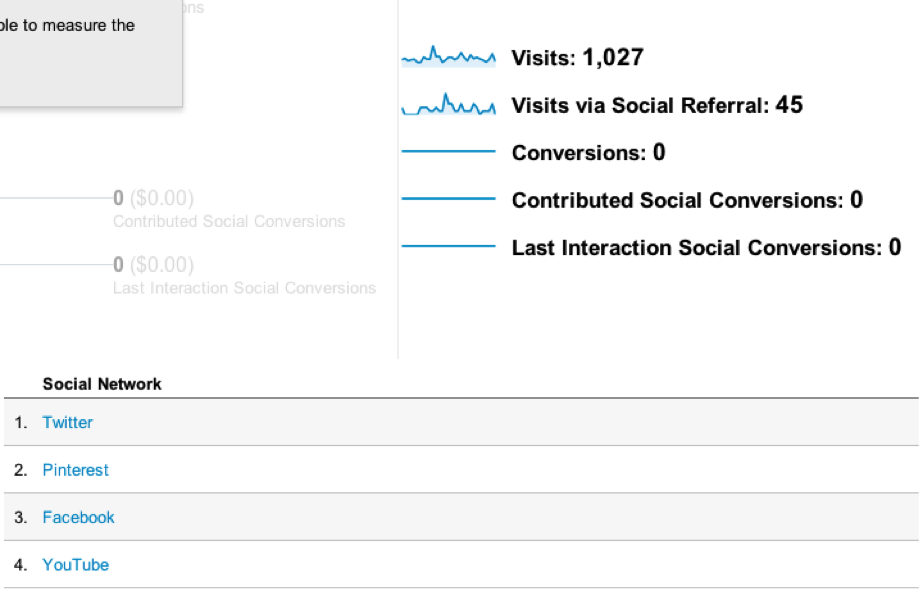
To dig in to more detail, navigate to the Social menu and take a look at the overview. The real beauty of Google Analytics is its ability to measure conversions – you can set up your analytics suite so that Google knows what you want your visitors to do.
For e-commerce sites, you can measure the basket value and see the exact monetary value of your social media traffic. In fact, Google Analytics is comprehensive enough that it can tell you which conversions came directly from social, which conversions included a social media contribution, and which conversions occurred when the customer’s last action was made through social media.
Even if you do not sell products directly from your website, you can still use goals to tell Google what you want your visitors to do. Business to Business (B2B) companies, for example, might want visitors to fill in a form, and sign up for a free consultation. In this instance, you can tell Google how highly you value these leads and it will do the maths and tell you the total value of the leads gathered.
Of course, you can then divide the amount of money that you spend on social on a monthly basis by the value of your social visitors over the last month to arrive at a return on investment (ROI) figure that you can use to justify social media use to the C-suite (also known as, The Bosses).
Step 5: Explore and learn
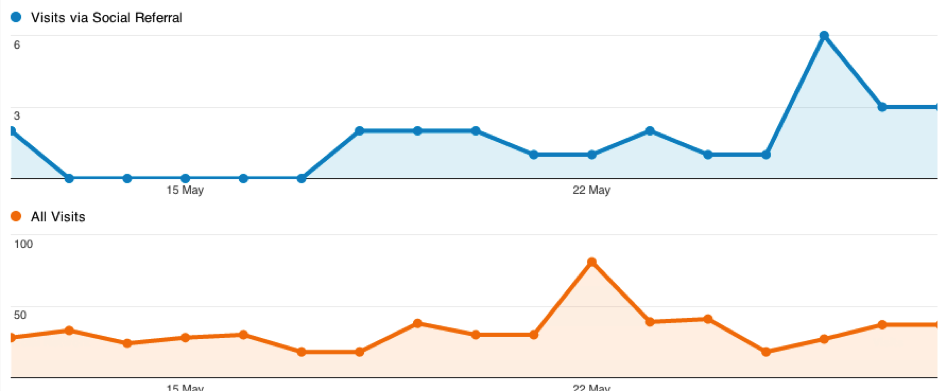
Now, hit Network Referrals to see daily, weekly and monthly charts which show how many of your visitors came through social.
Data Hub Activity shows whether your content has been discussed on third-party websites including Google+, Reddit and VKontakte (the leading social network in Russia).
The Landing Pages menu is useful if you want to know where your social visitors are arriving – it presents a list of each of the different URLs, along with the number of pages that your visitors went on to view.
You can also view your Trackbacks, which is a type of backlink that some bloggers use to notify site administrators when they have referred to their content.
Under Conversions, you can look specifically at the social visitors that have visited your website and converted by filling out a form or buying a product, filtering them by social network and analysing their average conversion value. You can also see what percentage of total conversions each social network is driving.
This is useful when considering dedicating additional resources to a specific social network – if you spend twice as much time on Facebook, but its conversion rate has only risen by 15 percent, it might not be such a good idea. It can also be useful to know which social networks drive the largest spend.
Finally, check your Plug-ins analytics to see which social sharing icons your visitors are using and which of your pages they share – that way, you have a better idea of what type of content works well. You can also take a look at the Visitors Flow, which shows you where your social visitors are arriving and which pages they go on to view.
Bottom line
Using Google Analytics is an excellent, low-cost way to measure whether your social media marketing activities are having a direct impact on the bottom line of your business. Nevertheless, it is important to remember that a social media presence is not just about selling products or services.
Sure, it is great when your marketing activity pays for itself, and it is always exciting to watch as your visitors’ average basket value increases. However, social has additional value for customer service, market research, thought-leadership and more.
By using Google Analytics, your business can measure the metrics that really matter and make informed decisions about the future of your marketing efforts. Are visitors from LinkedIn converting at a much higher rate than those coming in from Twitter? Intensify your efforts on the former and spend less time on the latter.
In fact, according to TechCrunch, Google Analytics has cornered 82 percent of the world’s market share and is in use on 55 percent of the world’s most popular websites. I can see why!
Do you use Google Analytics to measure your social media marketing efforts? What features do you find useful? Let us know with a comment.
Source: @ComMetrics | Google Analytics: 5 steps for better success

The author: This post was written by social media specialist Dane Cobain from UK-based creative agency first the Group.
He is also a gadget-lover and tech fanatic, as well as an internet addict.
Connect with ComMetrics on Google+ or the author using: Email | Twitter | Google+ | LinkedIn