 If you think social media metrics are useless, you’re not alone. They are time-consuming, heavy on the paperwork and sometimes downright awkward.
Social media metrics can add more useless numbers that distract you from getting the real job done. But that need not be the case: like performance reviews, social media metrics can serve as a road map to get your business where it needs to go if executed properly.
Trying to develop consistency in how you run your business is contingent on using resources effectively, and social media metrics are a way to set expectations and benchmarks.
- 1. Why Google Analytics cannot help
To illustrate, the bounce rate is defined as single page visits divided by total site visits, so naturally, a blog-reader that clicks on an off-site link results in an inflated bounce rate.
Why? Because this reader’s visit is considered a single page visit.
The inflated bounce rate makes the true metric useless and hides the success of the link-click engagement event. The data is correct, but it is based on an unsuitable measure for this type of strategy.
However, we have learned that readers who find us via a link from a particular news magazine spend an average of over 12 minutes reading the blog post and other material. Plus a much higher percentage sign up to get our posts via email. You should, too:
The above illustrates that a simple metric may lie. More importantly, focusing on the conversion rate (subscription) might show that another one of the many roads that lead to Rome could be a faster way to success.
- 2011 trendwatch webinar: Social media monitoring and ROI (return on investment)
=> BY THE WAY
A while back we launched our ComMetrics blog checklist from CyTRAP Labs GmbH. This post is part of our successful My.ComMetrics 2011 trend briefing series – sign up for our next webinar, you’ll be glad you did!
… JUST SO YOU KNOW
Trend 1: 2011 will bring us increasingly fancy measurement tools that promise more insightful engagement metrics. But simple is beautiful and watching to see if the trend goes in the right direction matters.
Tip 1: Less is more – cut out 80 percent of what everybody else measures. Focus on the key metrics that help you earn more revenue.
- 2. Metrics inflation – KISS (keep it simple stupid) is key
 TV folks have some metrics that make sense, are easy to get and help assess performance. Sky Deutschland’s latest quarterly results show improvements using four KISS metrics:
- a) net subscriber growth,
b) average revenue per user,
c) churn (i.e. how many subscribers do not renew their subscription after a certain time-frame), and
d) product sales.
A well-known metric in the retail industry is the conversion rate – the percentage of shoppers who enter a store and actually complete a purchase rather than just browse.
For instance, after Black Friday (sales held the day after the US Thanksgiving holiday, 2010-11-25), some retail analysts reported a 15 percent improvement in conversion rates compared to last year – a clear indication that Christmas sales might be improving.
Trend 2: Social media pundits will suggest that measuring everything will get us on the gravy train to more traffic, conversions and revenue. If you are lucky, such recommendations may apply to global brands, but they will most likely distract medium-sized companies from properly executing their marketing strategies.
Tip 2: Follow the TV industry and ensure that at least two of your five metrics make sense to your boss and the uninitiated (e.g., average time spent per visit, leads generated and conversion rate).
- 3. Cleaning up the mess – taking action
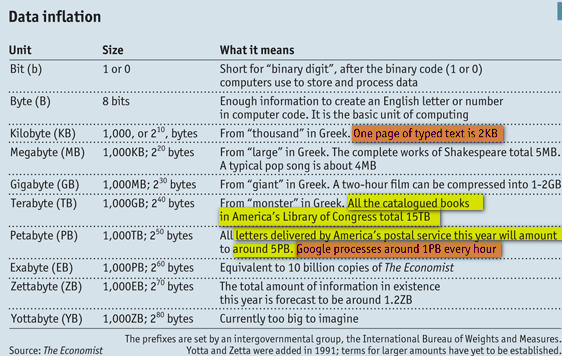 Figure out the most critical tasks a visitor should perform when they come to your blog or website. This is the most important step, regardless of the person’s age, gender, income, profession and country of residence.
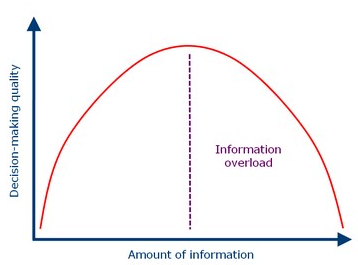
If you can measure that – even if it is an approximation based on your gut feeling – go for it. And yes, we already have too much data, and no, we cannot make sense of it, so much more information is unlikely to help you.
Trend 3: Sophisticated marketers get good hints from their measurements. Nevertheless, social media monitoring is still an art, not a science.
Tip 3: Compromise on your investment – if you don’t put in the resources, including time, you cannot get control of the challenge. Go big (within reason) or stay away from social media at your own peril.
The video below shows that when using statistics smartly, one can arrive at metrics that help one explain the trends including how health and wealth are related across countries. Really good 4.5 minute video from BBC – watch and smile.

Resources
Bounce rate – what it means and why blogs have lower ones
7 Signs your blog is going somewhere – BUT – your boss will not be impressed – guaranteed
The Metrics of Social Media (Danny Brown)
Regular energy efficiency monitoring correlates with better performance – 3-year payback (see right-hand column for latest results)
8 Social Media Metrics You Should Be Measuring – wish it were as easy as this blog post suggests
Are you with me on these social media analytics and social media ROI issues for 2011 or am I completely off? What have I missed? Please leave a comment; the floor is yours!
Pingback: Massimo Blangiardi
Pingback: Cathrine Thaning
Pingback: Natalie
Pingback: Jolt Social Media
Pingback: Giorgos Alexakis
Pingback: Simona Haasz
Pingback: Blake Parker
Pingback: Zafar Rais
Pingback: tobesocialDE
Pingback: tobesocialDE
Pingback: UX Feeder
Pingback: Urs E. Gattiker
Pingback: MyComMetrics
Pingback: CyTRAP
Pingback: Autom Tagsa
Pingback: Universal Info Srvcs
Pingback: Anggia Putri
Pingback: Prime Social Media